How dumb tools and smart agents shape AI reporting architectures.
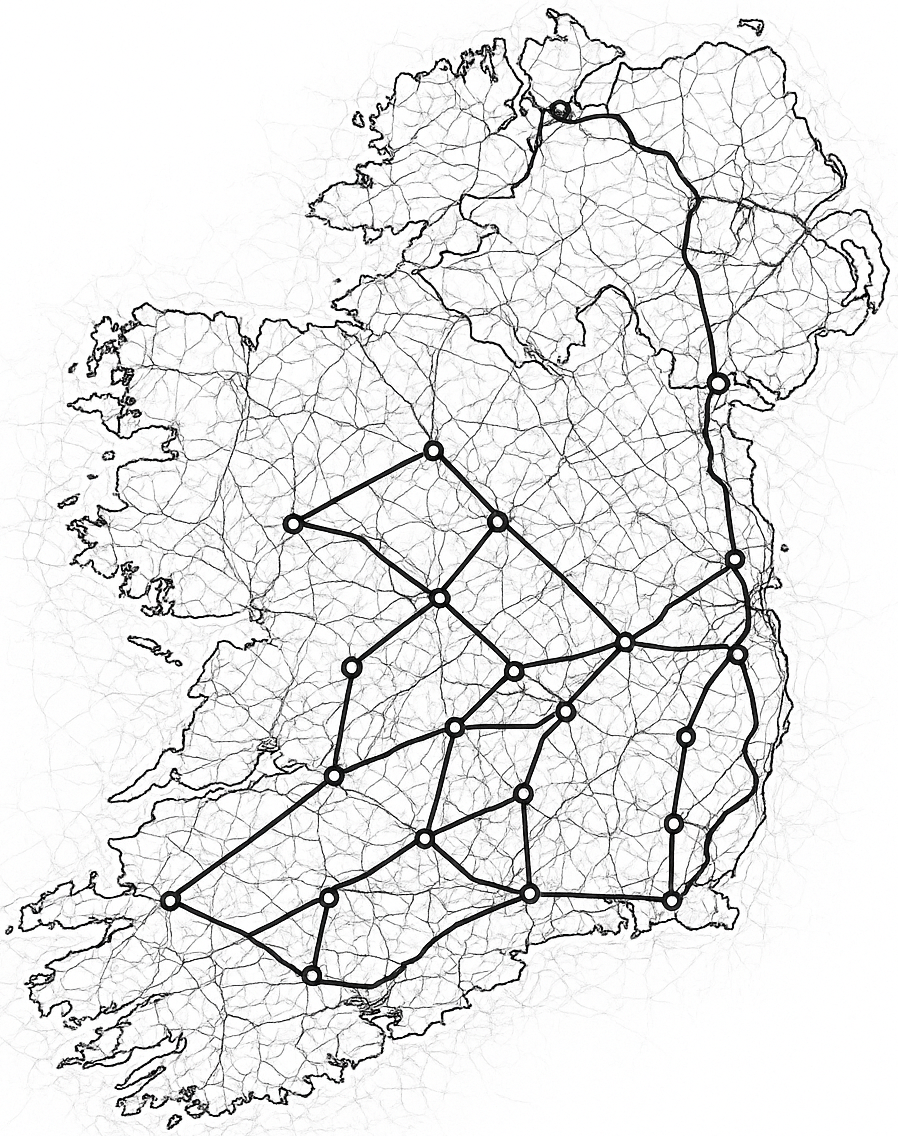
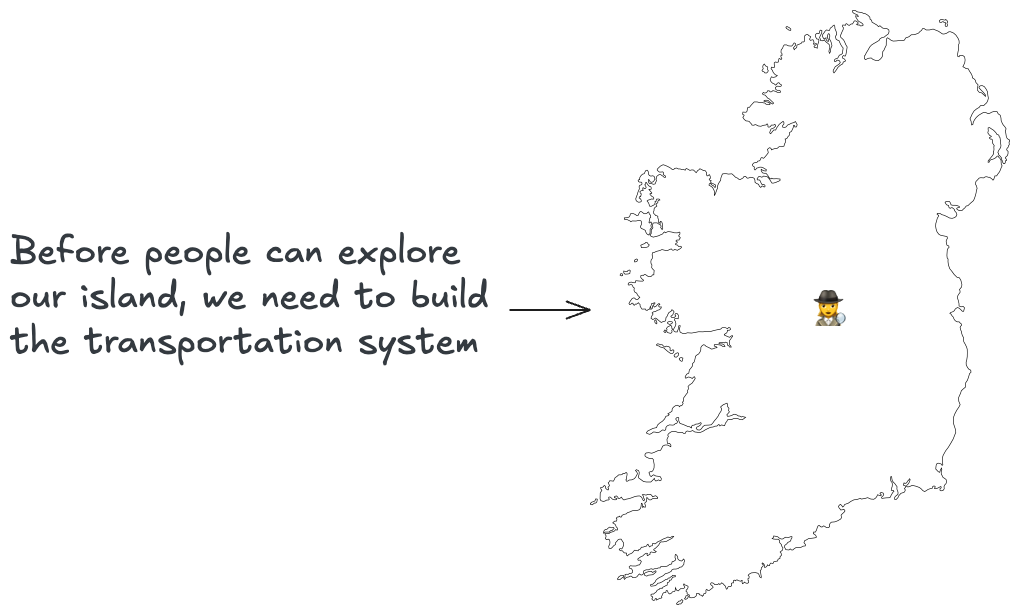
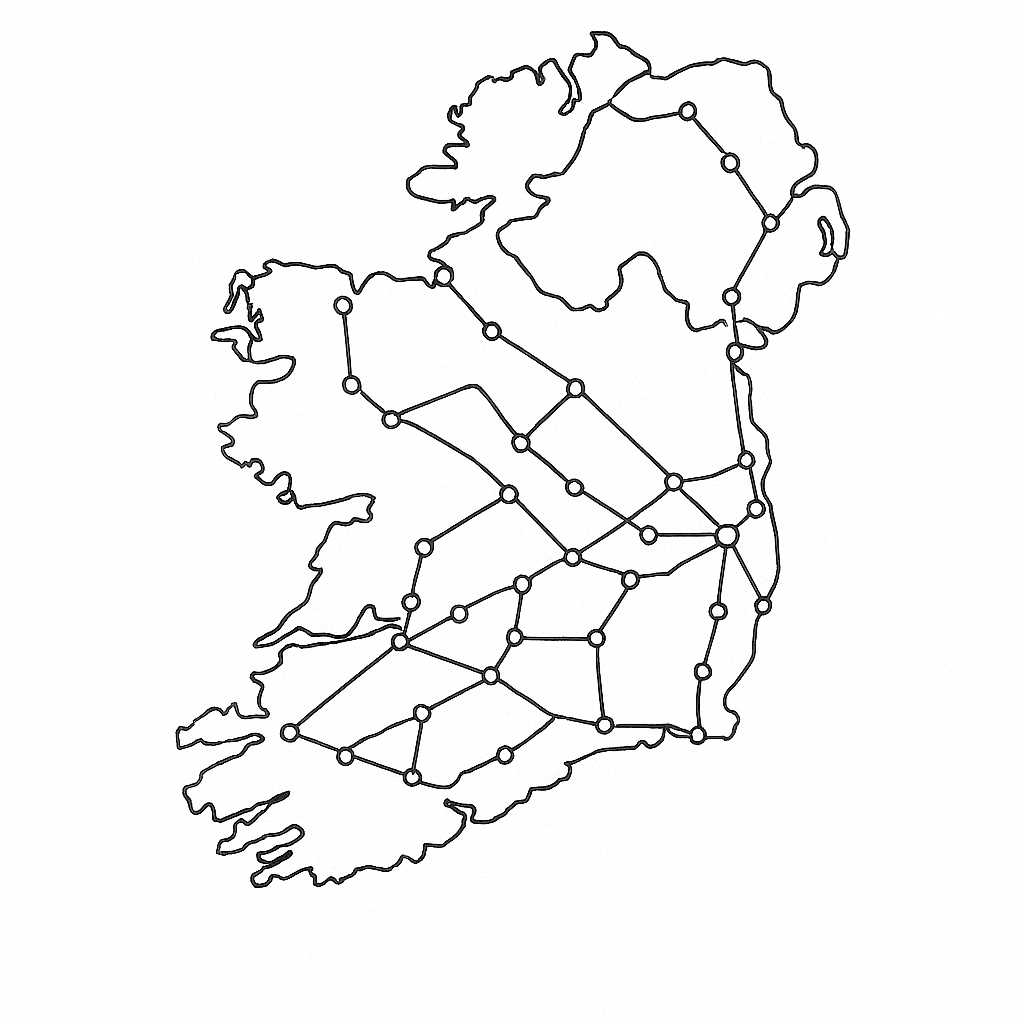
Picture a bare island with no roads or rails, and you’re the one tasked with creating the system that lets people travel anywhere they need to go.
That’s what AI reporting feels like: you’re building the infrastructure that determines where users can explore and how quickly they get there.
AI reporting is when a user asks a question in natural language and the AI analyzes your live data to give an instant answer.
Instead of relying only on pre-built dashboards, you expose your data model to an AI layer that understands your tables and metrics and can generate the right analysis on demand.
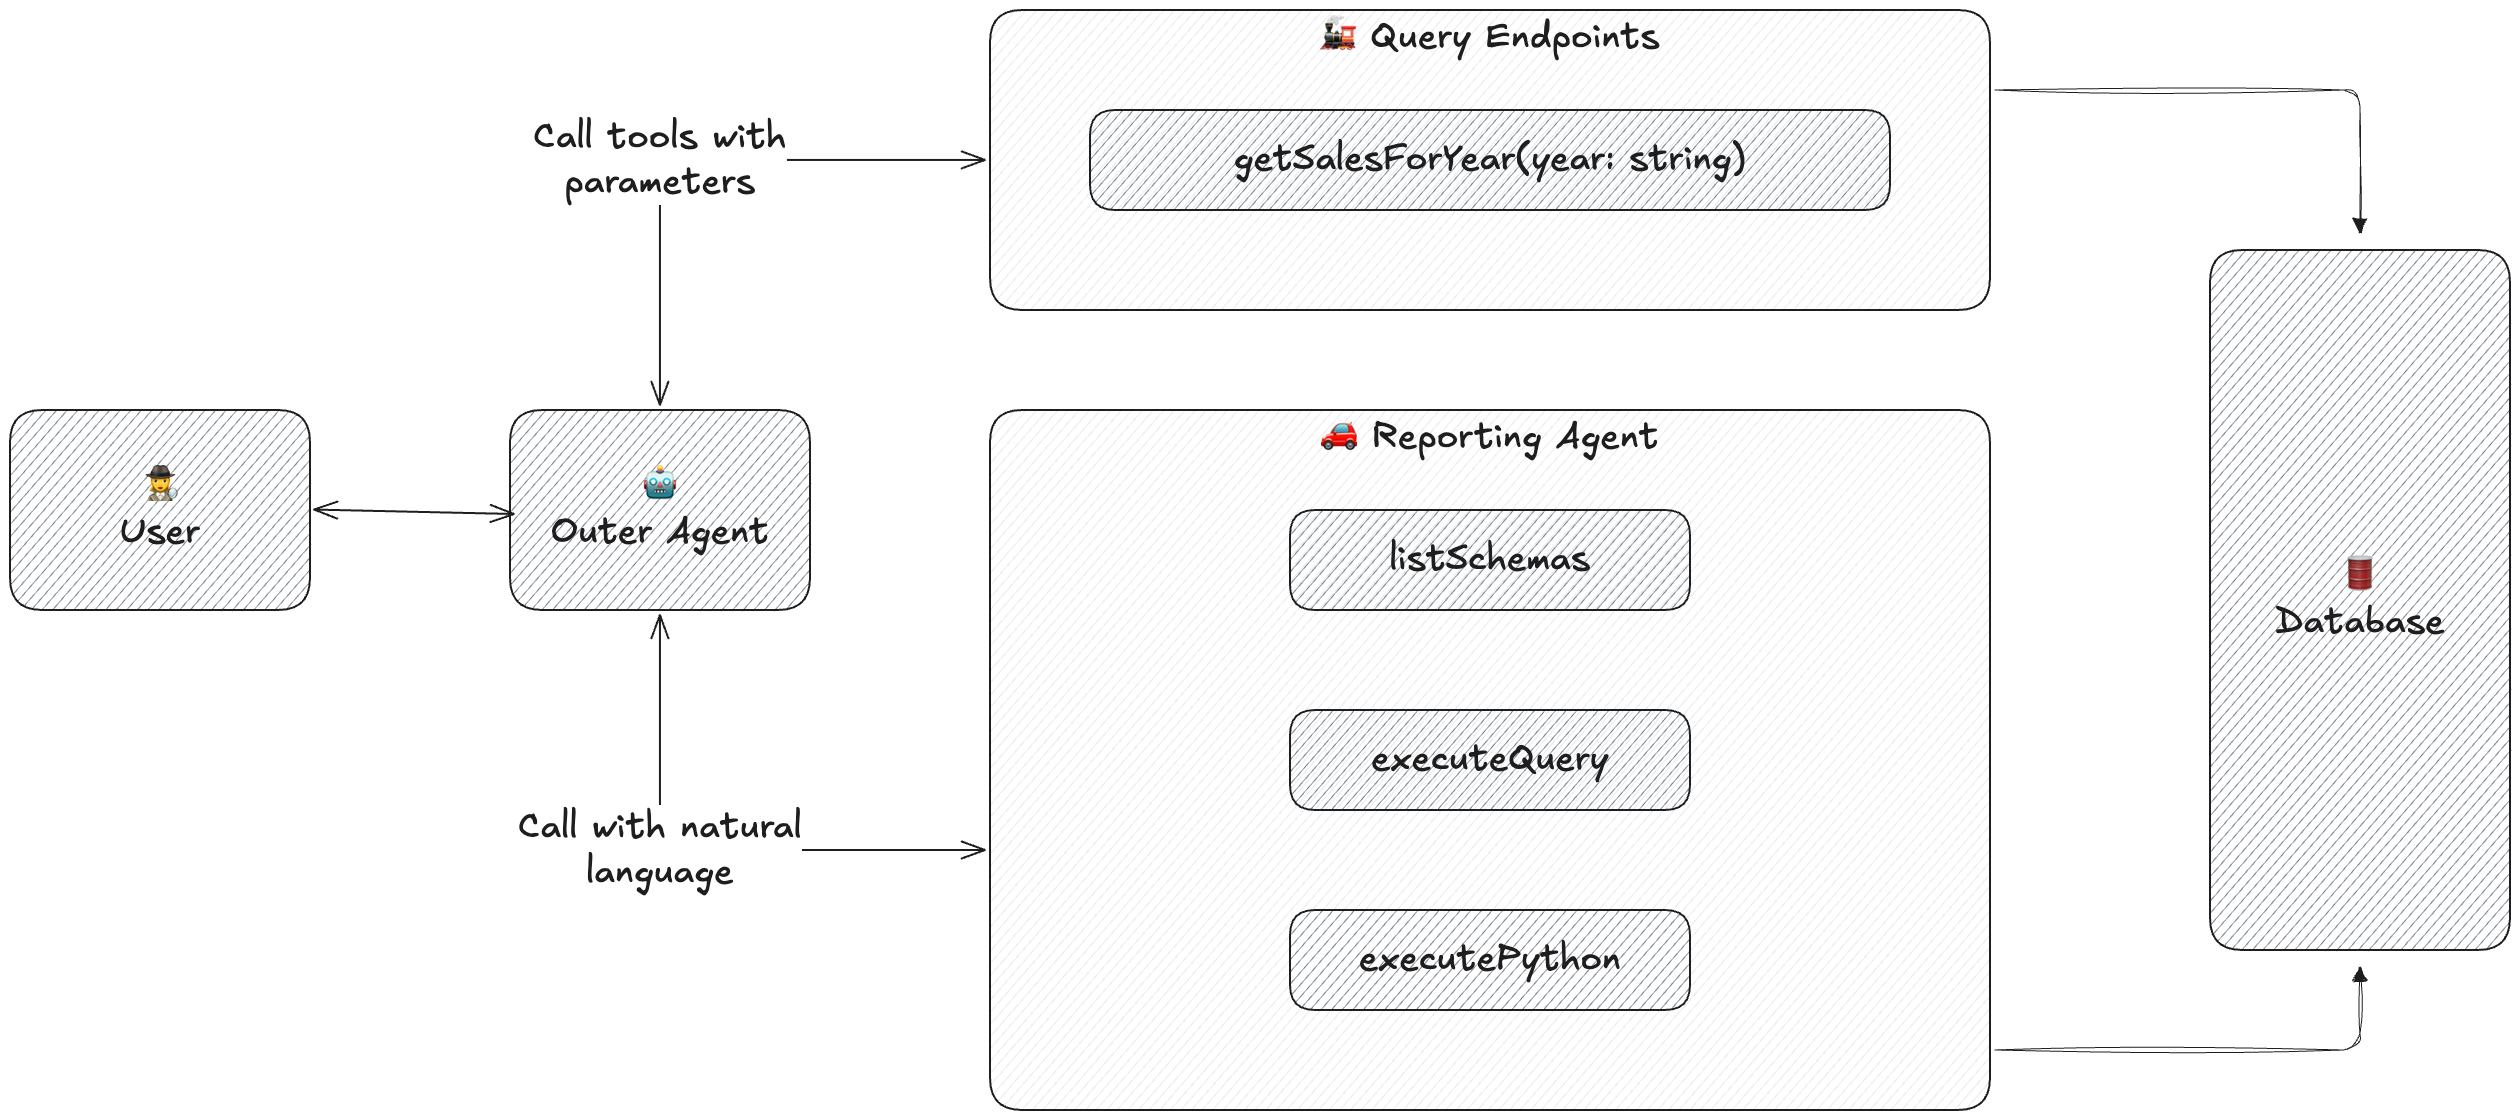
You have two main approaches to building this infrastructure:
You can think of the outer agent as the traveler: it takes the train when there’s a direct route, and switches to the roads when the journey isn’t as straightforward.
Query endpoints and reporting agents are both valuable - just different technologies with different strengths. There’s no reason to choose one or the other: query endpoints (🚂) are perfect for busy, well-worn routes, while reporting agents (🚗) handle the last mile and the unexpected places you didn’t even know users wanted to go.
The real magic happens when you stop choosing and start letting user behavior automatically build the connection between the two.
Query endpoints are like trains running on railway lines – fast but rigid.
They work well for popular routes: you can predict where users will go ahead of time, and the query is written at compile time, so they’re fast.
Every new question type you need to support means new tracks to lay — new endpoint shapes and more engineering effort.
As the number of endpoints grows, so does the surface area you need to maintain: tests, versioning, approvals, and keeping definitions in sync with a changing schema.
Reporting agents are like cars driving on roads — more flexible but slower on point to point journeys.

They can take any road across your entire data model. They understand tables, relationships, metrics, and dimensions, and they generate queries dynamically at run time rather than relying on pre-written shapes.
This flexibility comes with a cost: they incur a planning step. The agent has to interpret intent, reason over the schema, generate SQL, validate assumptions, and apply permissions — all of which makes them slower than a fixed endpoint.
But that planning step is also what gives them their reach. By reasoning over the schema itself rather than a set of predefined endpoints, they can answer any question that’s logically expressible in your data — even ones no one thought to prepare for.
This becomes especially important as your schema evolves. Reporting agents adapt automatically because they read the model directly.
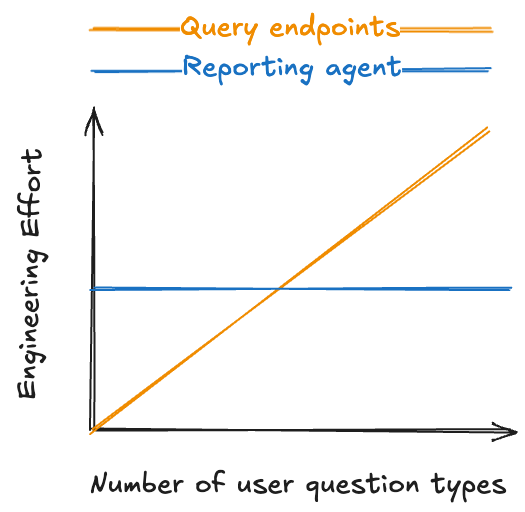
The need for new query endpoints grows linearly with the number of new question types you need to support. Engineering effort scales with the number of unique question types.
For reporting agents, once the schema is learned, each new question comes with almost no incremental engineering cost. Engineering effort scales with schema complexity.
This creates two different scaling curves:
In practice, reporting questions follow a long-tail distribution. A small number of questions get asked frequently, while the vast majority of questions are asked only once or twice.
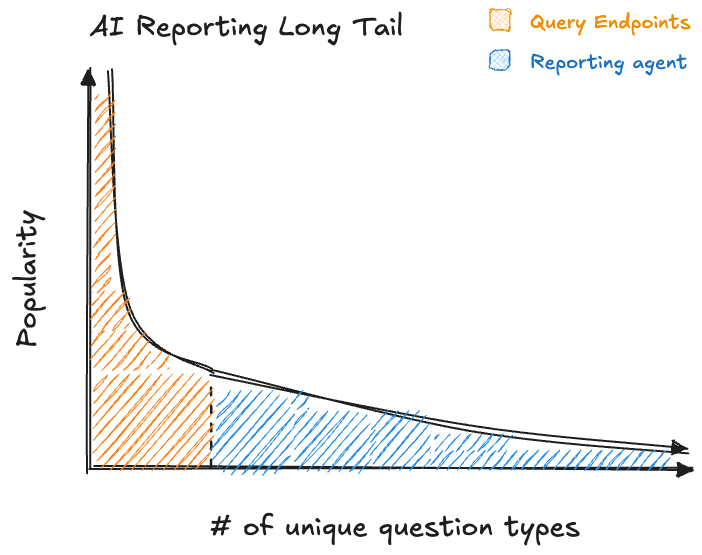
Query endpoints are perfect for the head of the distribution - build them for your top 10-20 most common questions and you’ll handle a large portion of frequently asked questions. This is where most teams start, and it feels like a quick win.
But here’s the critical insight: the long tail is where the real value and complexity lies. The head questions are ones you probably already knew people would ask - they’re the obvious “show me revenue trends” or “list top customers” queries.
The long tail is different. These are the one-off questions that you don’t consider building a dedicated endpoint for upfront: “What was our revenue in Q3 2024 for customers in San Francisco who purchased an iPhone 15?” Each question in the tail might only be asked once, but collectively they represent a significant portion of your users’ information needs - and more importantly, they represent questions you’re unlikely to have predicted in advance.
The head is easy. The long tail is where AI reporting actually delivers on its promise of “answer any question about your data.”
When your AI can’t navigate the long tail, the magic fades and the limits start to show.
We’ll compare a reporting agent and query endpoint connected to this database:

Show me the sales trend for the first 6 months of last year
Query Endpoint Approach:
The outer agent correctly identifies the getSalesTrendForYear query endpoint:
export async function getSalesTrendForYear(year: number) { return query( ` SELECT EXTRACT(MONTH FROM o.created_at)::int AS month_number, COALESCE( SUM( COALESCE(o.subtotal, 0) - COALESCE(o.discount, 0) + COALESCE(o.tax, 0) ), 0 ) AS total_sales FROM orders o WHERE o.organisation_id = $1 AND EXTRACT(YEAR FROM o.created_at) = $2 GROUP BY month_number ORDER BY month_number `, [SCOPED_ORG_ID, year] );}Next, it intelligently calls it with the parameter “2024”.
getSalesTrendForYear("2024");
[  { "month": "January", "totalSales": 18234.55 },  { "month": "February", "totalSales": 14620.12 },  { "month": "March", "totalSales": 21980.44 },  ...]
Finally, it pulls the entire response of getSalesTrendForYear into its context window and answers using only the first six months of last year, as requested.
Your sales over for the first 6 months of last year (2024) were as follows: January ($18,234.55), February ($14,620.12), March ($21,980.44), April ($15,422.18), May ($30,112.07), June ($19,850.01).
Reporting Agent Approach:
The outer agent reads the user’s input and passes a refined instruction to the reporting agent as plain language.
Analyze and present the sales trend for the first six months of last year
The reporting agent interprets that instruction, consults the schema, and generates the appropriate query.
SELECT TO_CHAR(created_at::date, 'YYYY-MM') AS month, JSON_BUILD_OBJECT( 'orders.total', SUM((subtotal - discount) + tax) ) AS totalsFROM ordersWHERE organisation_id = 1 AND created_at >= '2024-01-01' AND created_at <= '2024-07-01'GROUP BY monthORDER BY month ASC;It returns the result to the outer agent in an appropriate reporting format — for example, a chart.
{ "type": "chart", "message": "Here’s your sales trend for January–June of last year. Overall, sales increased steadily from January through May, with the strongest growth between March and May. June dipped slightly compared with May but remained higher than the earlier months. In short: a clear upward trend in the first half of the year, with a mild softening right at the end of the period.", "chart": { "type": "line", "data": { "labels": [ "2024-01", "2024-02", "2024-03", "2024-04", "2024-05", "2024-06" ], "datasets": [ { "name": "Total sales (January–June 2024)", "values": [18234.55, 14620.12, 21980.44, 15422.18, 30112.07, 19850.01] } ] }, "title": "Monthly Sales Trend (First Six Months of 2024)", "xLabel": "Month (2024)", "yLabel": "Total sales" }}Show me revenue broken down by category for our 5 highest spending users last quarter
This is the kind of question which teams rarely build an endpoint for upfront.
To support it, the endpoint would need to:
Hypothetically, its signature might look like this — but the real implementation would be highly specialized, and it’s unlikely anyone would build it before the question actually comes up.
getTopUserCategoryRevenue((top_n = 5), (sort_by = "user_total_revenue"));And when a question is time-sensitive, you need the answer immediately. Waiting to build a new endpoint after the first failure is, for all practical purposes, too slow.
A pure endpoint-based system would fail to answer this question.
The reporting agent handles this naturally because it can compose new SQL at run time by reasoning over the schema.
First it reframes the intent to a reporting context
Generate a tabular breakdown of the revenue generated for each category purchased by the Top 5 highest-spending users.
It can analyze the query and generate multiple SQL queries to get the correct data.
First get the top 5 users with the most spend:
SELECT user_id, SUM(total) AS revenueFROM ordersWHERE organisation_id = 1GROUP BY user_idORDER BY revenue DESCLIMIT 5Then using those ids get each of their spends by category:
SELECT user_id, category, SUM(total) AS revenueFROM ordersJOIN products USING (product_id)WHERE user_id IN (...)GROUP BY user_id, categoryORDER BY revenue DESCFinally it responds with an appropriate reporting output:
{ "type": "table", "message": "Here’s the revenue by product category for the top 5 highest‑spending users (to date).", "table": { "head": [ "User Name", "Category", "Revenue" ], "body": [ [ "Nettie Greenfelder", "Smartphone", "12828.63" ], [ "Noah Bins", "Desktop", "10407.41" ], ... ] }}This is the long tail in action.
The question is:
And yet the reporting agent answers without any additional engineering work required, because it is capable of schema reasoning.
Rather than choosing between rails and roads upfront, consider letting usage patterns guide your infrastructure decisions. Start with reporting agents, then pave the well-worn paths.
Think of desire paths: those worn trails in grass where people naturally walk, eventually becoming paved sidewalks.

Your reporting system can work the same way:
This approach gives you the flexibility of dynamic queries from day one, while automatically optimizing for speed as usage patterns emerge. The reporting agent literally paves its own desire paths - no monitoring dashboards, no manual optimization, just infrastructure that evolves with actual usage.
The real power of AI reporting comes from treating your data model like a landscape, not a menu.
Let users explore it freely with AI reporting agents, then let usage patterns reveal where the high-traffic routes are. Those become your query endpoints.
You’re no longer guessing which endpoints to build. Users carve the paths and the system reinforces them.
The result is an AI reporting architecture that adapts as your product evolves: fast where it needs to be, flexible everywhere else, and aligned with real user behaviour rather than assumptions.
Not rails or roads, but a network that evolves the way real transportation systems do, shaped by demand and reinforced by usage.